This is an old revision of the document!
Table of Contents
What are metrics?
Metrics are numerical values that can track anything about your environment over time, from latency to error rates to user signups.
In Datadog, metric data is ingested and stored as data points with a value and timestamp:
[ 17.82, 22:11:01 ]
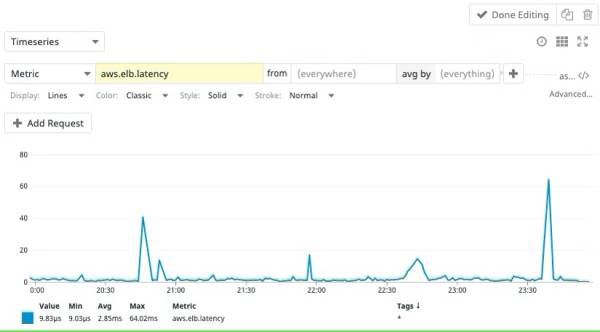
A sequence of data points is stored as a timeseries:
 [ 17.82,  22:11:01 ]
 [  6.38,  22:11:12 ]
 [  2.87,  22:11:38 ]
 [  7.06,  22:12:00 ]
Any metrics with fractions of a second timestamps are rounded to the nearest second. If any points have the same timestamp, the latest point overwrites the previous ones.
Why are metrics useful?
Metrics provide an overall picture of your system. You can use them to assess the health of your environment at a glance. Visualize how quickly users are loading your website, or the average memory consumption of your servers, for instance. Once you identify a problem, you can use logs and tracing to further troubleshoot.
Metrics that track system health come automatically through Datadog’s integrations with more than 800 services. You can also track metrics that are specific to your business—also known as custom metrics. You can track things such as the number of user logins or user cart sizes to the frequency of your team’s code commits.
In addition, metrics can help you adjust the scale of your environment to meet the demand from your customers. Knowing exactly how much you need to consume in resources can help you save money or improve performance. Submitting metrics to Datadog
Metrics can be sent to Datadog from several places.
Datadog-Supported Integrations: Datadog’s 800+ integrations include metrics out of the box. To access these metrics, navigate to the specific integration page for your service and follow the installation instructions there. If you need to monitor an EC2 instance, for example, you would go to the Amazon EC2 integration documentation.
You can generate metrics directly within the Datadog platform. For instance, you can count error status codes appearing in your logs and store that as a new metric in Datadog.
Often, you’ll need to track metrics related to your business (for example, number of user logins or signups). In these cases, you can create custom metrics. Custom metrics can be submitted through the Agent, DogStatsD, or the HTTP API.
Additionally, the Datadog Agent automatically sends several standard metrics (such as CPU and disk usage).
For a summary of all metric submission sources and methods, read the Metrics Types documentation.
Datadog supports several different metric types that serve distinct use cases: count, gauge, rate, histogram, and distribution. Metric types determine which graphs and functions are available to use with the metric in the app.
The Datadog Agent doesn’t make a separate request to Datadog’s servers for every single data point you send. Instead, it reports values collected over a flush time interval. The metric’s type determines how the values collected from your host over this interval are aggregated for submission.
A count type adds up all the submitted values in a time interval. This would be suitable for a metric tracking the number of website hits, for instance.
The rate type takes the count and divides it by the length of the time interval. This is useful if you’re interested in the number of hits per second.
A gauge type takes the last value reported during the interval. This type would make sense for tracking RAM or CPU usage, where taking the last value provides a representative picture of the host’s behavior during the time interval. In this case, using a different type such as count would probably lead to inaccurate and extreme values. Choosing the correct metric type ensures accurate data.
A histogram reports five different values summarizing the submitted values: the average, count, median, 95th percentile, and max. This produces five different timeseries. This metric type is suitable for things like latency, for which it’s not enough to know the average value. Histograms allow you to understand how your data was spread out without recording every single data point.
A distribution is similar to a histogram, but it summarizes values submitted during a time interval across all hosts in your environment. You can also choose to report multiple percentiles: p50, p75, p90, p95, and p99. You can learn more about this powerful feature in the Distributions documentation.
See the metrics types documentation for more detailed examples of each metric type and submission instructions.

